Teaching information & communication theories
Teaching a theoretical subject matter in any field can be challenging especially if the audience concerned is geared towards practical and professional placement into the workforce. Such types of students are often unconvinced about the relevance of theory to their imagined professional practices. My students concerned are such professionally-oriented students, destined to work in the communication sector as organisational communication consultants, public relations officers, social media managers, journalists, media spokesperson, web content publishers, etc. The pedagogical challenge for me was to bring home to them that there can be no effective communication strategy without an underlying theory and that indeed theory govern most of our "rational" actions whether we are aware of it or not. Hence, the challenge for me was to illustrate the interdependency between theory and practice, i.e, the fact that theory informs practice and practice can in turn lead to modifying existing or propounding new theories, and also the fact that although the theories they were going to learn about were propounded decades ago, they are still relevant in our digital world.
My second pedagogical goal was to encourage the students to build their own representations of abstract concepts and ideas, here, how information and communication operate in the society, both in the personal and professional spaces.
Lastly, integrating a creative approach in the teaching of a course that can otherwise be boring if delivered in the traditional professoral “lecture-style” mode was motivated by the desire to increase students’ engagement and appropriation of the course content.
I adapted the drawing approach to theoretical courses I teach on entitled “Theories of Information and Communication” to first year masters’ students at the School of Journalism and Communication of Aix-Marseille University.
From iSquares to cSquares
|
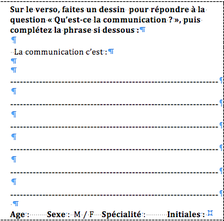
Following the iSquare protocol, students were given a 4.25" by 4.25" piece of paper and asked to verbally express their understanding of communication on the front side and in the form of a drawing on the blank side of the paper (see image below) .
The draw and write exercise was performed at the very first class, thus before the students received the course contents, in order to capture their prior conceptions of the concept under study. This led to collecting several hundreds of drawings of information (iSquares) and of communication (cSquares) over three years (2014-2017) which are analysed below and on the page "From drawing to storytelling. This has also give rise to publications which can be found on the relevant page. |
|
Analysis of the iSquares and cSquares (2015 collection)
I first experimented with the iSquare protocol to study students' conceptions of information in one of my courses entitled “Information, a resource for the enterprise” in the first trimester of 2015. 52 iSquares were thus collected.
I then extended it to the concept of communication in a course entitled “Theories of Information and Communication” which I have been teaching since 2014. This led to collecting 24 cSquares in 2014; 74 cSquares in 2015 and 65 cSquares in 2016.
I analysed the drawings collected in 2015 (52 iSquares and 74 cSquares in these two separate courses) in order to determine if there were similarities or significant differences in the way the concepts of information and communication were depicted.
It should be noted that there is a significant overlap amongst the students who produced the 52 iSquares and 74 cSquares. Roughly, two-thirds of the students were enrolled in both courses. However, it is not possible to study how the same student rendered these two concepts since the squares are anonymous (no names).
- First, we sought to classify the drawings into broad categories of graphic representations;
- Next, we performed a thematic analysis to identify the major themes in the drawings and connected them to the theories they seemed to evoke;
- Thirdly, we triangulated the above information by reading the textual definitions on the other side of the drawings to see if they corroborated or diverged from our interpretations.
- Finally, we sought for transversal themes, i.e., recurrent themes in both iSquares and cSquares.
|
1. Classification of the graphic representations
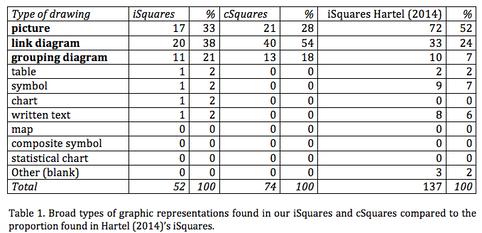
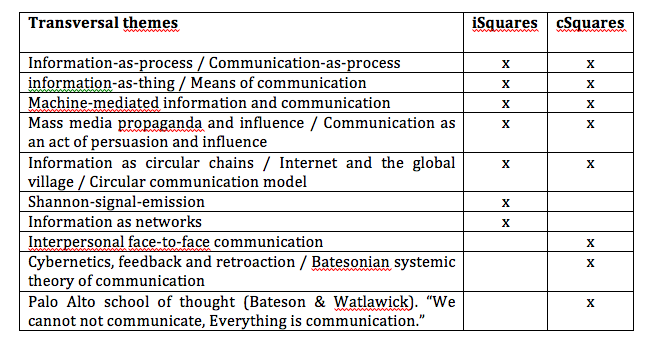
Based on Engelhardt’s 2002 classification of graphic representations used by Hartel (2014) to classify her iSquares, we give in Table 1 below, the types graphic representations found in the iSquares and cSquares and compare them to those found by Hartel (2014) in her collection of 137 iSquares. As the table below shows, pictures, link and grouping diagrams were prominent in our students' drawings (for their definitions, see Engelhardt 2002). These findings concurred with the ones made by Hartel’ in her 2014 study. In the case of cSquares, they were the only categories present. |
However, we note that pictures were more popular in Hartel’s iSquares (72 out of 137) whereas in our case, link diagrams were the most popular type of graphic representation both in our iSquares and cSquares. The iSquares reflect students’ perception of information as a tangible thing, hence the drawings portrayed more the means through people accessed information (formats, media, titles) and how the information was gained (speaking, reading, listening). On the other hand, the drawings in the cSquare clearly had a more relational feel to them, linking diagrams were by far the most preferred type of graphic representation (40 drawings out of 74 cSquares were link diagrams against 20 link diagrams in our iSquares out of 52). The cSquare drawings were also more cluttered with students using up most of the space to represent the complexity and the circular nature of communication: the objects and people depicted were almost always involved in some form of interaction. These differences could be explained by three reasons :
- a bias in our classification: it was sometimes difficult to decide if a drawing fell under a category or the other. In particular, it was difficult to decide between link and grouping diagrams;
- an academic bias: our student population are communication and media studies majors. It is possible that their academic baggage inclined them towards a particular type of graphic representation, in this case, more towards the linking diagrams that better conveyed the relational aspect of communication than towards isolated figures (pictures) unlike for information studies students. This is purely a conjecture at this stage that will require more dedicated inquiry.
- the absence of the other types of graphic representation (written text, symbols, statistical charts or tables) in the cSquares could be once again due to academic bias: the perception of communication by students as something more relational, more dialogic in nature than information, hence it could not be "properly" rendered using logical cold symbols as tables, charts (statistical and time) or other abstract symbols.
2. Thematic analysis of the drawings
|
Thematic analysis is a qualitative analytical technique used to explore recurrent themes appearing in a corpus of texts. As explained on the dedicated wikipedia page, “Thematic analysis goes beyond simply counting phrases or words in a text and moves on to identifying implicit and explicit ideas within the data».
I tried to identify the prevalent themes in the iSquares (2a) and the cSquares (2b). Our preliminary findings are presented below. Galleries 1 & 2 hereafter give examples of iSquares and cSquares depicting each theme. Clicking on an image will open it in its own window and display its caption. 2a. Themes prevalent in the 52 iSquares (2015 collection) The drawings of information evoke some well-known theoretical conceptions. Buckland’s (1991) famous tripartite characterisation of information was as ever much in evidence. Many drawings bore testimony to his tripartite distinction between information-as-thing, information-as-process and information-as-knowledge. Overall, we perceived six recurrent themes in our iSquares:
(1) Buckland, M. (1991). Information as thing, Journal of the American Society for Information Science & Technology, 42(5), 351-360. |
2b. Themes prevalent in the 74 cSquares (2015 collection)
A more fine-grained analysis of the 74 cSquares than the one we offered here enabled us to regroup the conceptions of communication found in these drawings around 3 broad themes which are further subdivided into more detailed themes. 1. Means of communication i- Interpersonal communication (verbal and non verbal) ii- Machine-mediated communication (mass media, ICTs) 2. Circular and complexity model of communication iii- cybernetics and systemic theories of communication (Norbert Wiener) iv- "We cannot not communicate” or communication as behaviour (Palo Alto School, Bateson & Watlawick) v- “Communication as a connector: Internet and Global village (Marshall McLuhan) 3. Effects of mass media communication vi- Shannon-Weaver transmission model / functionalist-behaviourist conception of communication vii- the hypodermic syringe model of communication (Harold Lasswell’s 5W); agenda setting theory of the mass media (McCombs & Shaw, 1972) viii- the importance of intermediaries and opinion leaders (Paul Lazarsfeld’s 2-step-flow of communication) ix- Communication as an act of persuasion and influence. |
Gallery 1. Drawings exemplifying the six prevalent themes found in the 52 iSquares.
Gallery 2. Drawings exemplifying the prevalent themes found in the 74 cSquares
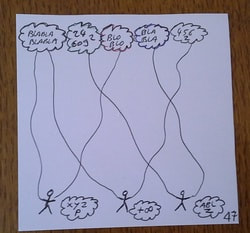 Information spirals iSquare
Hartel (2014) recalled that researchers using the draw and write technique in other fields felt that “the written portion of the exercise is crucial to understand the meaning of the drawing (Briell et al., 2010)”.
Hartel (2014) analysed the correspondence between the drawings and textual definitions in 137 “information squares” (aka iSquares) drawn by students at the School of Information Studies, University of Toronto. She found that the relationship between some drawings and their textual definitions of information were often confounding, i.e. they were not correlated. We replicated her experience in a French setting, first to study the conceptions of information (iSquares), and then extended it communication (cSquares). We found Hartel’s observation to be largely true for students' conceptions of information (iSquares) but much less their renditions and verbal expressions of communication (cSquares).
For instance, we were bewildered by this abstract representation of information which we termed "information spirals". as it offered no clue about the student's perception of what information. We had to rely on the textual definition on the other side of the drawing which read ‘Information is noise: Nowadays everything is distorted to buzz more than your neighbour. Information is what enables us to retain what suits us in order to defend our ideas.’
This iSquare portrays the idea that information is at best noise and at worse propaganda, thus echoing the same ideas of the influence of the mass media propaganda that we found in some of the cSquares.
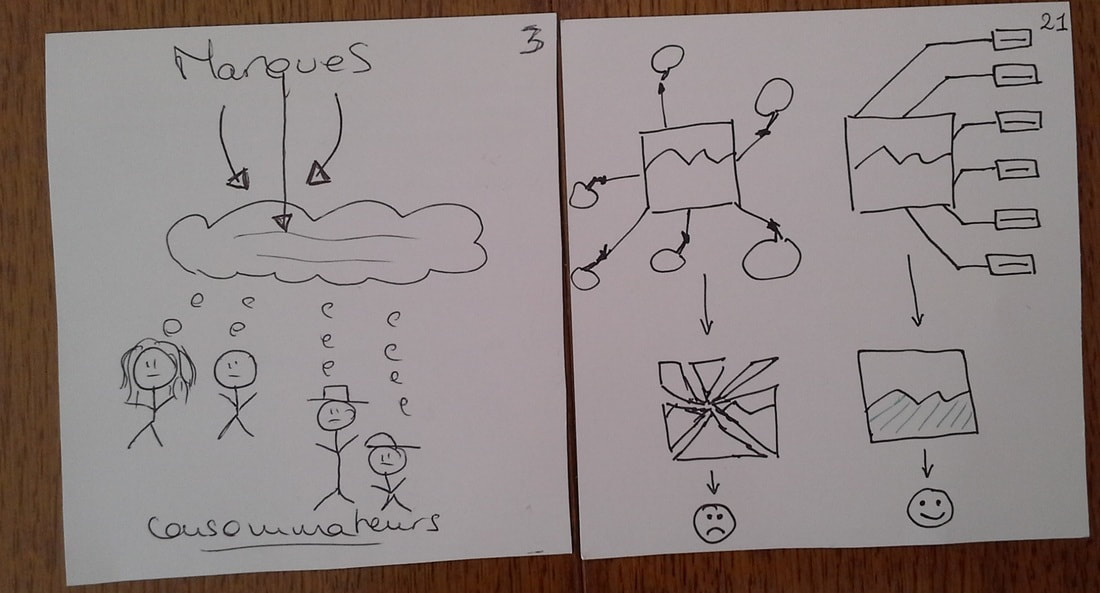
Overall, we found that there tended to be a correlation between the drawings and the textual definitions in the cSquares. Students often used the text to reinforce the impression they tried to convey with their drawings such that there was a form of redundancy between the two. For instance, the textual definitions behind the two cSquares (3, 21) depicting communication as an act of persuasion and influence explicit.ly corroborate this reading. The textual side of cSquare 3 reads "Communication is “to orient the thought of a consumer or even manipulate his/her acts in order to bring him/her to consume and integrate a specific message" while cSquare 21 sees communication as “a set of methods and tools used by a company/organisation with the aim of building, improving its image and adjusting to its environment.”
On the other hand, there was more divergence between text and drawing in the iSquares. Students seemed to use a mode of expression (written or visual) to complement the other by expressing a characteristic of information that was not perceptible in the first mode whereas in the cSquares the students tended to use the two modes to convey the same facets of communication. There were however a few cases where drawings and accompanying textual definitions diverged in the cSquares.
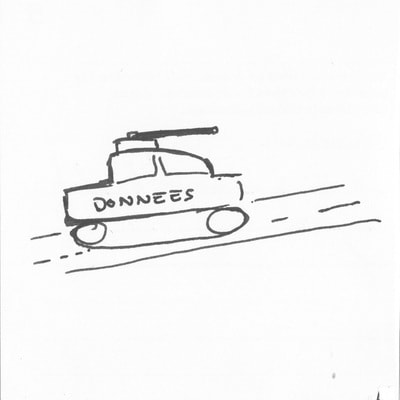
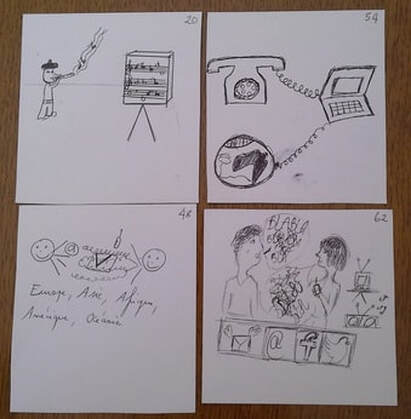
Surprisingly, none of the textual definitions to the four cSquares in Gallery 2 (cSquares depicting machine-mediated communication) make explicit reference to the use of modern technological devices for communication, although one can consider that this is implicit in the Shannon-Weaver transmission paradigm which they all evoke to varying degrees, since this model implies the use of technology to encode, transmit and decode messages. What matters in these definitions is the content of the communication (message) and the process.
The definition to cSquare 20 reads Communication is “is the art of communicating something to someone, it is the manner in which a message is formulated and transmitted.” while cSquare 48 defined communication as the “transmission of a message from someone to another person or a group of people. The message can be written, oral, digital or non verbal.” cSquare yet again saw the role of communication as that of “establishing a relation with one or more people in order to transmit a message.”. Lastly cSquare 62 offered a terse definition of communication as “Speaking, seeing, hearing.”
These definitions seem to have been inspired more by the Palo Alto school of thought for which communication is not just the content but the relation created between the participants and the manner in which the content is conveyed. This is apparent in definitions 20 and 54. In short, the textual definitions seem somewhat at odds with the drawings which emphasised modern technological devices whereas the definitions insisted on the human aspect of communication as a message which has to be put in shape and given a form, or as a relation between people wishing to interact. Hence the definitions here are closer to the first category of interpersonal communications cSquares analysed than to machine-mediated communication.
The text-to-drawing correspondence will necessitate further studies, preferably in more cross-cultural and international setting.
4. Common themes in both iSquares and cSquares
The Shannon-Weaver mathematical model of information overshadowed practically all the drawings in both iSquares and cSquares, insofar as the vast majority of them were about messages being emitted, transmitted, received and acted upon by the receivers. However, in the cSquares, students did not use the abstract kind of drawings we found in the iSquares to represent the emission process. They favoured more relational, circular forms in the cSquares (symbolism of the circle?).
The overarching impression, across the link diagrams is that of information in movement that flows from one person to another thus creating communication and relation. Information and communication are perceived here as phenomena in constant circulation which is reminiscent once again of Norbert Wiener’s cybernetics theory that information and communication are the basic components of our universe and of a democratic world, thus they should be free to circulate without any constraints or censorship to avoid sclerosis and the return to chaos.
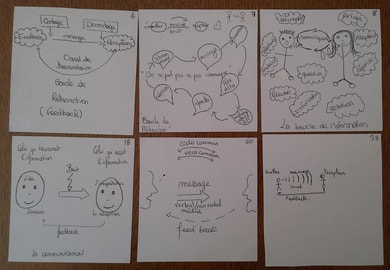
Hence, in the minds of the students, Shannon-Weaver linear model of information and communication and Wiener’s cybernetic model are not opposed but form a continuum. Students often evoked both models in the same representation, either the drawing portrayed one model while the accompanying textual definition complemented it with the other model. For instance, in one of the iSquares, a student clearly tried to capture both Shannon and Wiener’s information and communication models in one drawing which depicted a communication process with a (i) sender (émetteur), (ii) a receiver (récepteur), (iii) the communication content and in the middle (iv) noise (bruit), below the words (v) retroaction and feedback. A separate drawing beneath the previous one has the words data and receiver linked by an arrow and lines.
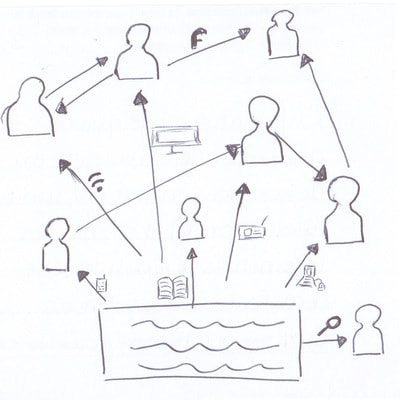
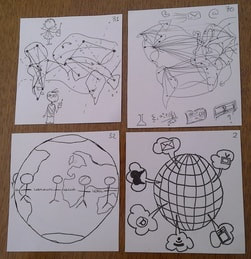
Also, the iSquares classified as “Information as networks” (see Gallery 1 above) could be likened to the cSquares depicting communication as “Internet and Global village” (see Gallery 2 above). They both convey the idea of a globe covered with information or communication technologies and artifacts, connecting people and abolishing, time, distance and geographical barriers. This is very reminiscent of a wienerian ideology of a democratic world governed by the free flow of information.
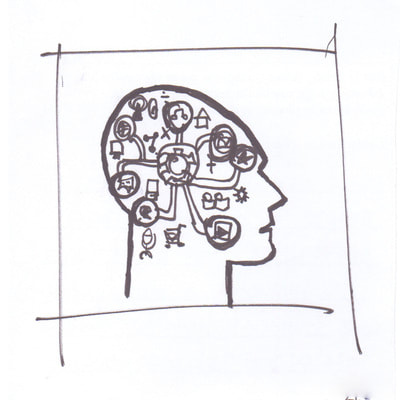
In the iSquares, the drawings grouped under “Information-as-process” are similar to the cSquares we grouped under “Interpersonal communication” because they both portray the conception of information and communication as a human phenomena, albeit with notable differences. In the iSquares, the “Information-as-process” images showed the interior of the head (3rd image in Gallery 1 above) whereas the cSquares which could come under this label "communication-as-process" depicted were grouped under the circular and complexity model of communication defended by the Wiener and the Palo Alto school.
Notwithstanding the subtle variations in the way of in which information and communication were rendered by the students, a fundamental set of themes appear to be prevalent in both conceptions of information or communication, thus reaffirming the proximity of the two concepts both epistemologically (their meanings cannot entirely be dissociated one from the other) and historically. Indeed, some of the most influential and popular theories of information and communication were propounded simultaneously by researchers who knew each other and mixed in the same circles (Shannon and Wiener, the Macy conferences which ran between 1941 and 1960). The major themes found in both collections of iSquares and cSquares were the following:
- mass-media influence/propaganda theory (Lasswell’s hypodermic syringe model of mass media effects, Lazarsfeld’s two-step-flow of communication and media the agenda setting theory);
- means of information and communication (Shannon-Weaver model, information-as-thing, machine-mediated information and communication via ICTs);
- “information-as-process” which can be extended to “communication-as-process”, i.e., the process of informing someone or of communicating with someone; the cybernetic communication model, Bateson, Watlawick and the Palo Alto school of thought.
Thematic Analysis of the 74 cSquares
I started by looking at the graphic representations in order to determine what they portrayed (the major themes), the linked these themes to the information and communication theories they illustrated or evoked. Lastly, I triangulated my interpretation by reading the textual definitions on the other side of the cSquare to see if these verbal expressions corroborated or diverged from my interpretation of the graphic representations.
This led me to identify 4 major themes which appeared to be recurrent in this collection of 74 cSquares :
This led me to identify 4 major themes which appeared to be recurrent in this collection of 74 cSquares :
- Interpersonal communication
- Machine mediated communication
- Mass media propaganda
- Internet and global villageExamples of drawings illustrating each theme are given below.
|
1. Interpersonal communication
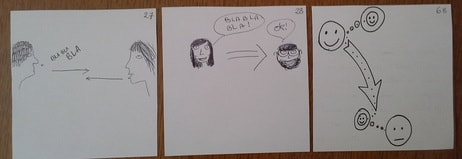
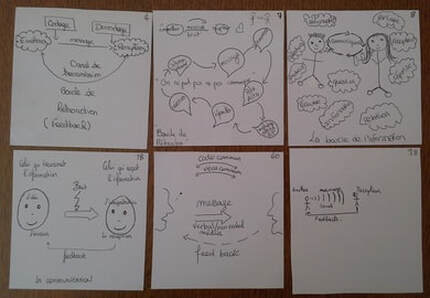
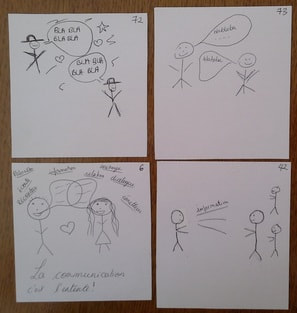
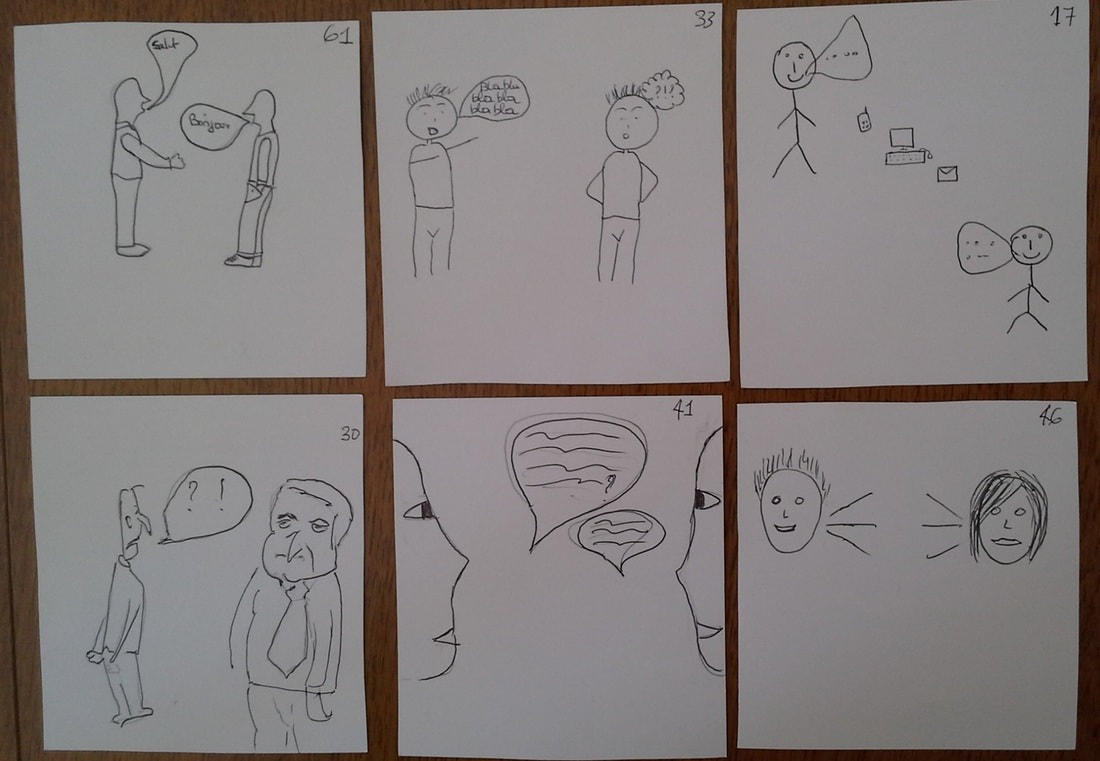
Many of the picture cSquares depicted interpersonal communication situations using either stick figures (cSquares 6, 42, 72, 73 in Figure 1), or whole or parts of persons (faces, mouths) involved in face-to-face interaction (cSquares 17, 30, 33, 41, 46, 61 in Figure 2) as evidenced by the “bla bla bla” repeated in many speech bubbles. These drawings portray some of the most intuitive and earliest conceptions of communication as being essentially a human oral phenomenon. The drawings seem a timely reminder that despite the profusion of ICTs and our enslavery to them, communication is and should still remain a human and face-to-face affair. They evoke early communication theories and in particular the Palo Alto school of thought which studied interpersonal communications amongst psychiatric patients, their caregivers and family members in hospital settings. Paul Watlawick, a founding member of the Palo Alto school with Gregory Bateson, defended the thesis that “we cannot not communicate”. It is the belief that there is no zero behaviour and that everything we do or say or do not do or say conveys a message to somebody and influences others. Hence, according to this school of thought, behaviour is communication, from our facial expressions to our tone of voice and posture, to what we say or do not say and we cannot choose not to communicate! Influenced by cybernetics (Norbert Wiener, 1948) and systemic theory, for proponents of the Palo Alto school, communication is not a linear phenomenon like information (despite Shannon calling his theory “A mathematical theory of communication”) but is enmeshed in a complex chain of actions and interactions. Hence, communication is not an act that can be studied in isolation, independently of its context and of other actors. cSquare (6) illustrates this school of thought by portraying a dyad in communication with the words “Palo Alto, listening, receiver, information, relation, message, dialogue, sender” around them and writing under the drawing “Communication is agreement” (La communication c’est l’entente!) |
|
2. Machine-mediated communication
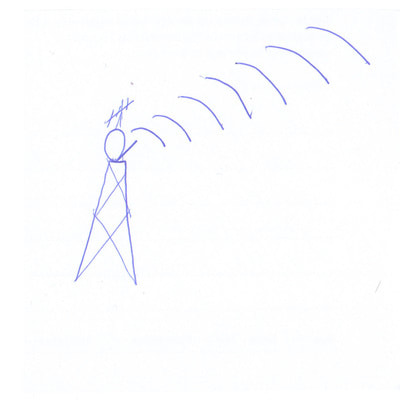
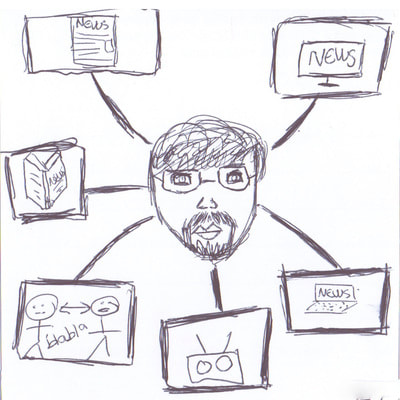
In this second set of picture cSquares (20, 48, 54, 62), communication is no longer viewed as a solely human affair but is mediated by technological devices. These drawings evoke the beginnings of mass media communication with the wide adoption of radio and television in the first half of the 20th century, with more modern technological devices becoming widely available towards the end of the 20th century (personal computers, emails). The 21st century saw the widespread use of social media (Facebook, twitter and email icons are shown on cSquare 62). Although, humans are still present on these drawings, they have a less prominent role than in the interpersonal communication cSquares. Interpersonal and group communication are henceforth mediated by technological devices. Across these three sets of drawings – interpersonal and machine-mediated communication cSquares (Figures 1, 2 and 3), we see the beginnings of a history of ICT inventions and how communication has evolved from being a direct human-to-human interaction to machine-mediated. |
|
3. Mass media propaganda
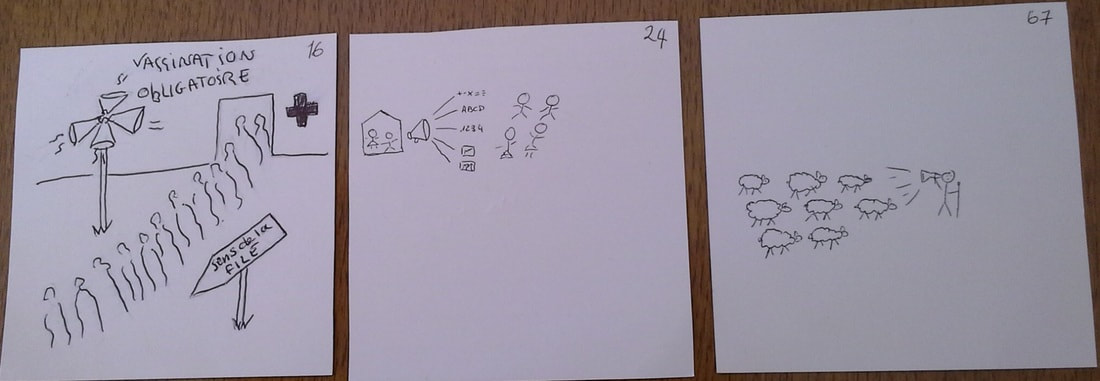
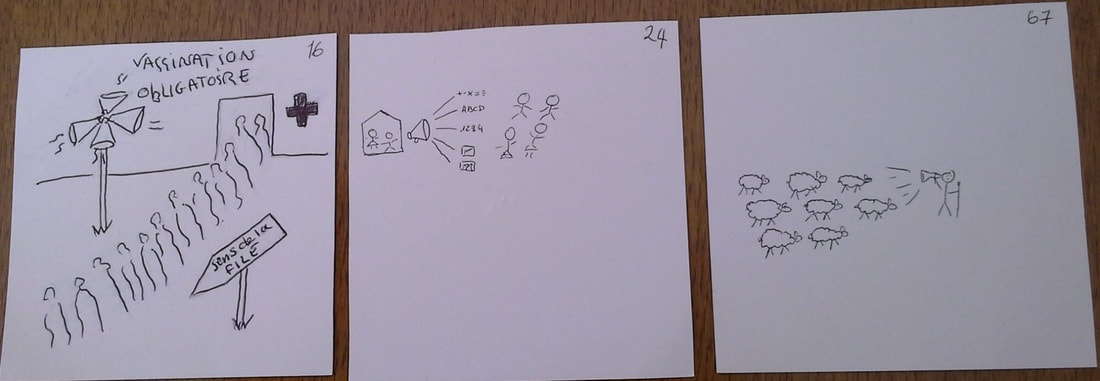
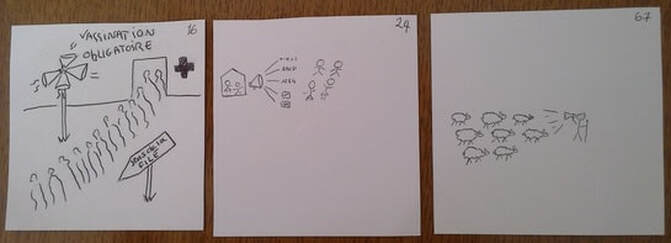
The drawings in cSquares 16, 24, 67 appear to showcase the popular and tenacious belief that the mass media have a big influence on shaping people’s perception of reality and not always in a disinterested fashion. cSquare 16 in particular is an allegorical depiction of the "crowd effect" and portrays the masses blindly following an authoritative voice or a leader who could be the State, a charismatic leader, a gourou, a celebrity and being eventually led astray or to the slaughter. The scene is that of a mass vaccination program, the drawing bears the title “Compulsory vaccination” and the instruction “Direction of queue” with people queuing up and waiting obediently to be injected with the vaccine. |
|
4. Internet and global village
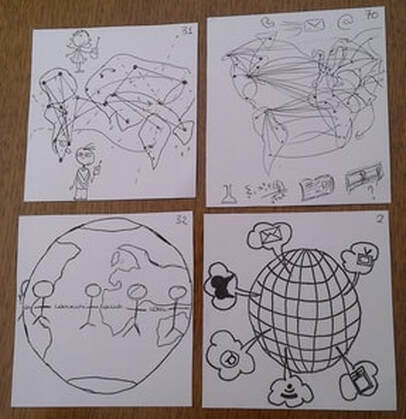
Drawings that illustrate this theme (cSquares 2, 31, 32, 70) move us away from the local level (interpersonal face-to-face communications) through the meso level (machine mediated communication) and onto a macro or global level where the world has effectively become a village. All the continents are interconnected via information and communication technologies (ICTs). ICTs enable people at distant geographic locations to communicate in real-time. In cSquare 2, the surface of the globe is covered by digital communication devices (radio, television, postal mail, email, wifi) with no humans present. These drawings are evocative of Marshall McLuhan’s The Gutenberg Galaxy, in which he predicted that the next set of inventions would make the world a global village. Internet and the web have enabled global and instantaneous transmission of information (rather than communication), thereby abolishing time, distance, linguistic, social and cultural constraints. His prophecy echoes the cybernetic ideal of the free circulation of information and communication, considered of strategic importance by Norbert Wiener for the betterment of the human condition and of the society. What is amazing is how aptly our students' drawings captured complex and abstract theoretical discourse that were propounded decades ago (as early as 1927 for some) and largely debated by the scientific community, without resorting to a lengthy verbal discourse or making very elaborate graphic designs. |
